![]()
|
|
![]()
|
|
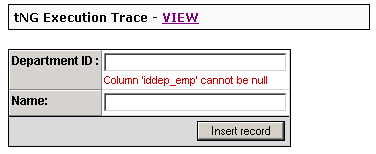
The stack trace is available only when the site is in development debug mode. It is a valuable tool for the developer, as it displays all instructions related to the Transaction Engine 3 that are available on page, both the ones executed before an error has been raised, as well as the ones that were not executed due to the premature halt of the application.
In the first step, the entire stack trace is not shown, only the fact
that it is there and a link to expand its view being displayed, as in
the image below.
Only after clicking on the View link, the entire list of instruction
is displayed, the one that caused the halt of the program being marked
with red:
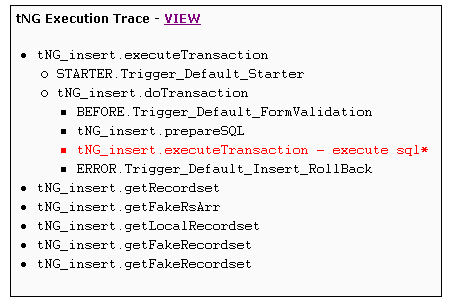
As you can see, the list displays all the Transaction Engine related instructions, like the ones belonging to the triggers and transactions on page, in the order they were meant to be executed. This way, the ones that got run are displayed above the error, and the ones left to execute are below it.
Using this stack trace, together with the other developer details and
the related help provided for each error, debugging the page to avoid
future errors is easy.