Debugging mode
This user interface allows setting the debugging mode to either Production
or Development, as well as configuring some particular options. To understand
the specifics of these two debugging modes, please see Development
Mode Error Handling and Production
Mode Error Handling.

- In the Debug mode drop-down
menu select the debugging mode to use for the site. There are two modes
available: Development and Production.
- The Error reporting
drop-down menu is enabled when your debug mode is the Production
one. Select where to save data about errors:
· None
- information about the errors that occurred is not kept.
· To
file - all error data is saved in a log
file inside the includes folder (includes/tng/logs).
· By
email - an e-mail message containing the error detail is sent.
When selecting this option, the following fields are enabled.
- In the Email log to
text-box, enter the email address where the error logs will be sent.
- In the Subject text-box
enter a subject for the mail. It should be a suggestive one, to make it
easier to find.
- In the From text-box
enter the source email address.
- The three buttons on the right of the interface offer
you the next functionalities:
· Click when you are done configuring the dialog
box.
· Click to exit without changing the
debugging mode settings.
· The button takes you to this help page.
In order for the change of the debugging mode to take effect, you must
upload the includes folder to the remote site.
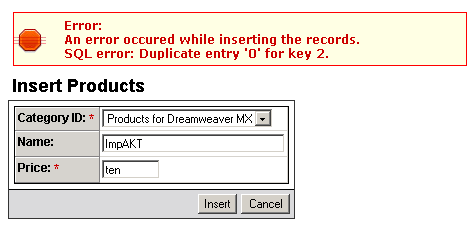
To get a preview of how errors are handled in each of the two debugging
modes, notice the next two images.
This image illustrates the occurred error when the debugging mode is
Development:

This image illustrates the occurred error (same as above) when the debugging
mode is Production: