![]()
|
|
![]()
|
|
The Database Diagram allows you to:
Visually edit your SQL query.
View and better understand the logical structure of your database.
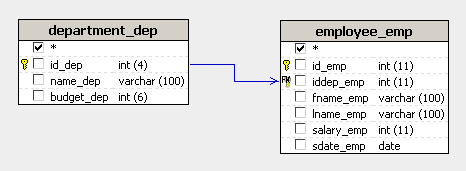
A typical query diagram contains the following elements:
database tables.
relations between tables.
After clicking a checkbox from the Tables panel, the corresponding table will appear in the database diagram.
Once multiple tables are displayed in the diagram, relations can be added between them.
When a relation is added, a line appears between the two tables, with an arrow pointing to the direction of the JOIN SQL statement. This means a LEFT JOIN will point to the left table, and a RIGHT JOIN will point to the right table. For definitions of the different types of JOIN statements, see the Glossary tab. To help define relations, and query parameters, the primary keys of each table are automatically identified and marked with a key icon.
The positions of each table in the diagram can be changed by using the
mouse to drag and drop a table anywhere in the diagram. The line representing
the relation will stay attached to the table wherever it is moved.